Form Follows Data
By Adrien Segal
May 11, 2020
As a 2020 Latham fellow, Adrien shared her emerging ideas on ID’s 2020 Latham theme, data and design, by giving a lecture and participating in a question-and-answer session (moderated by ID faculty member Zach Pino), as well as publishing the following freely available digital content.
Why make data physical?
Anyone familiar with data visualization might already know what design elements are used to encode data into graphic imagery—shape, size, value, texture, orientation, position (x, y), and color. Visualizations are designed to appeal only to the eye, the most dominant perceptual sense in humans. This approach is valuable, but ignores the potential for encoding data in unconventional ways that transcend the visual.
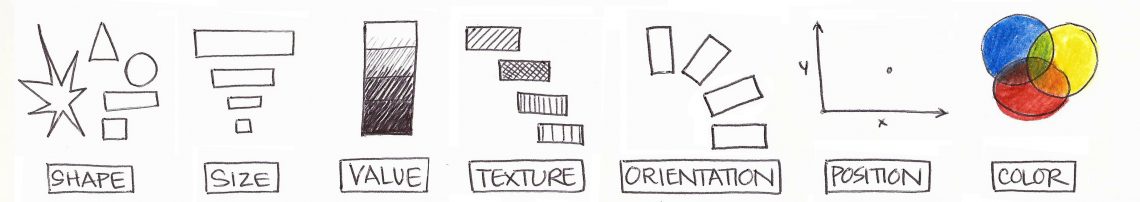
Design elements are used to encode data into graphic imagery: shape, size, value, texture, orientation, position (x, y), and color.
Some of the earliest data visualizations were actually physical methods used to record and track quantified data. I propose there are three distinct additional design elements that arise when data is represented physically—form, material, and three-dimensional space. These additional means of representation appeal to our tactile nature and can communicate directly with the body, tapping into perceptual senses that are involved in building and retrieving memory, emotional engagement, and the sensation of touch.
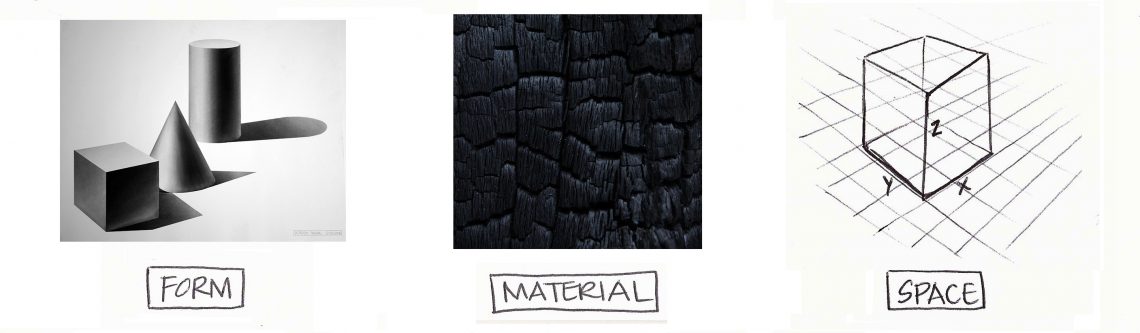
Three distinct additional design elements that arise when data is represented physically: form, material, and three-dimensional space.
I should mention that my background in furniture design and woodworking is an indication of my affinity for designing for the body and working in the physical realm. During my thesis, I arrived at data visualization through a circuitous path of research, beginning with visual illusions and encoding machines, leading finally to data visualization after learning about the work of Edward Tufte.
On form, material, and space
Form is synonymous with geometry, and is enhanced with light and the shadows that are cast from its volume. I believe form is immensely important in engaging the body in an experience. Form Follows Data, the title of this writing and associated Latham Fellowship lecture, stems from the architectural adage form follows function, meaning that the shape of a building (or object) should relate to its function or intended purpose. The question I propose is: Can a form be designed with the intended purpose of communicating information?
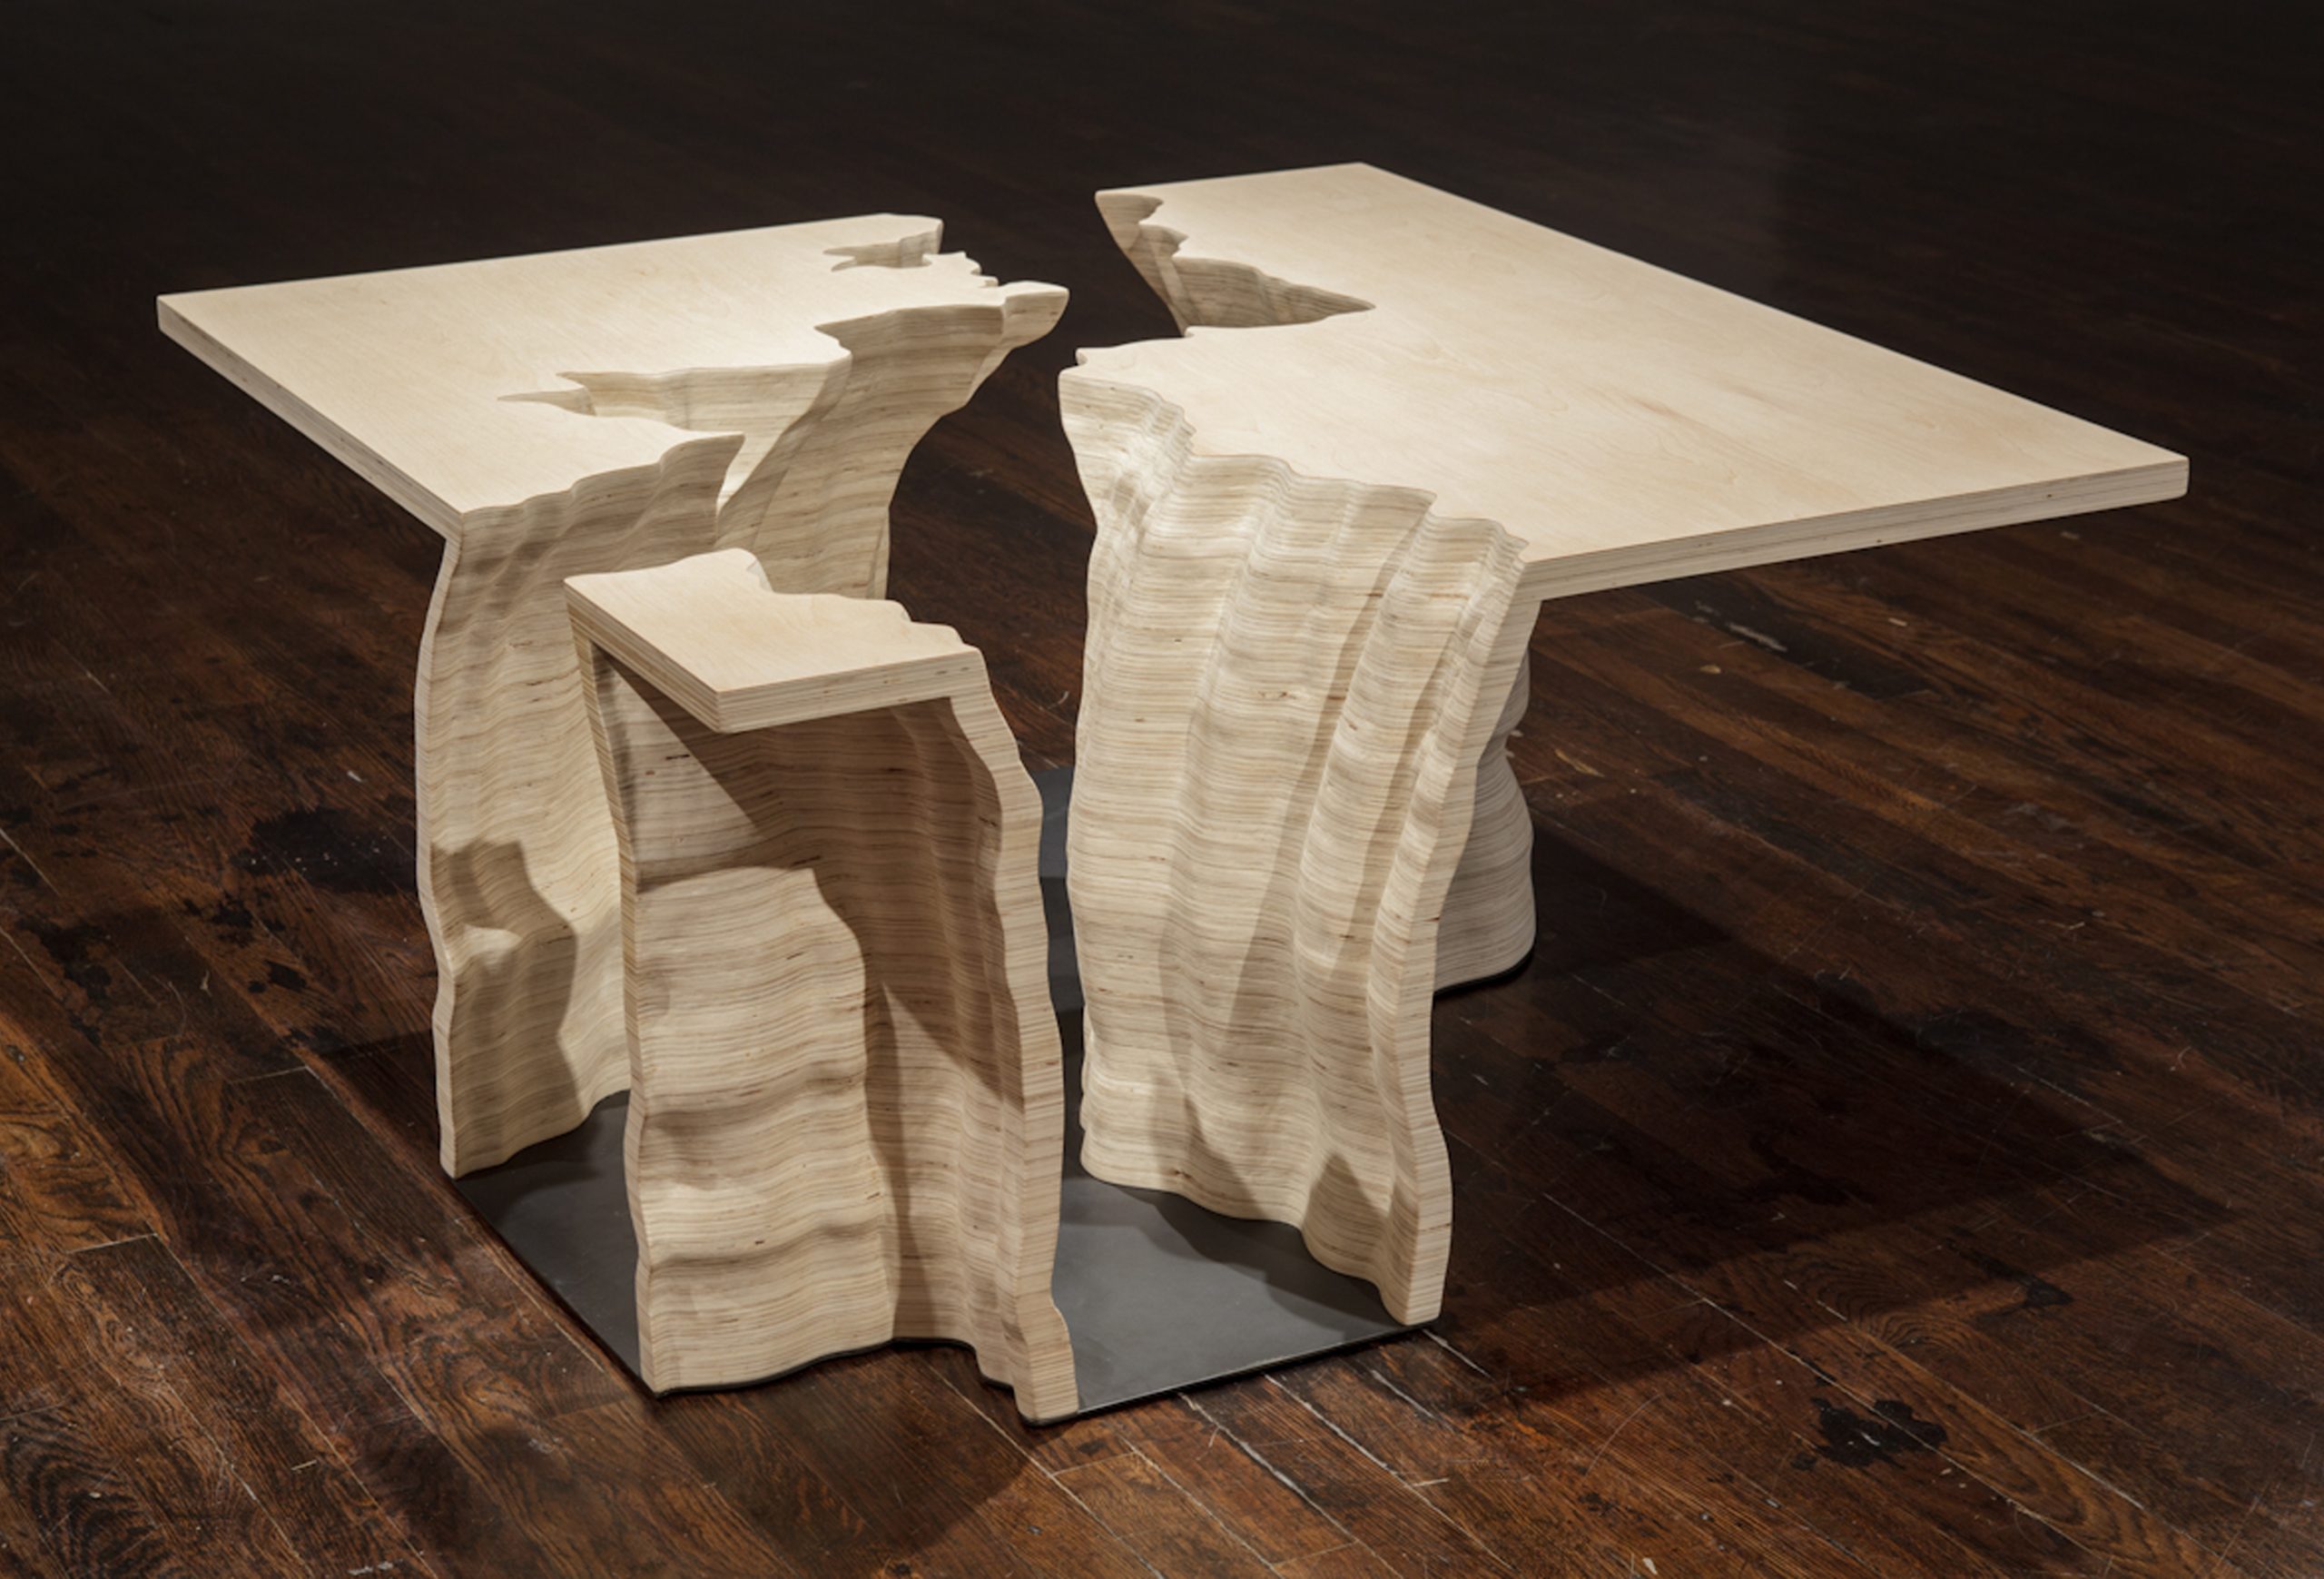
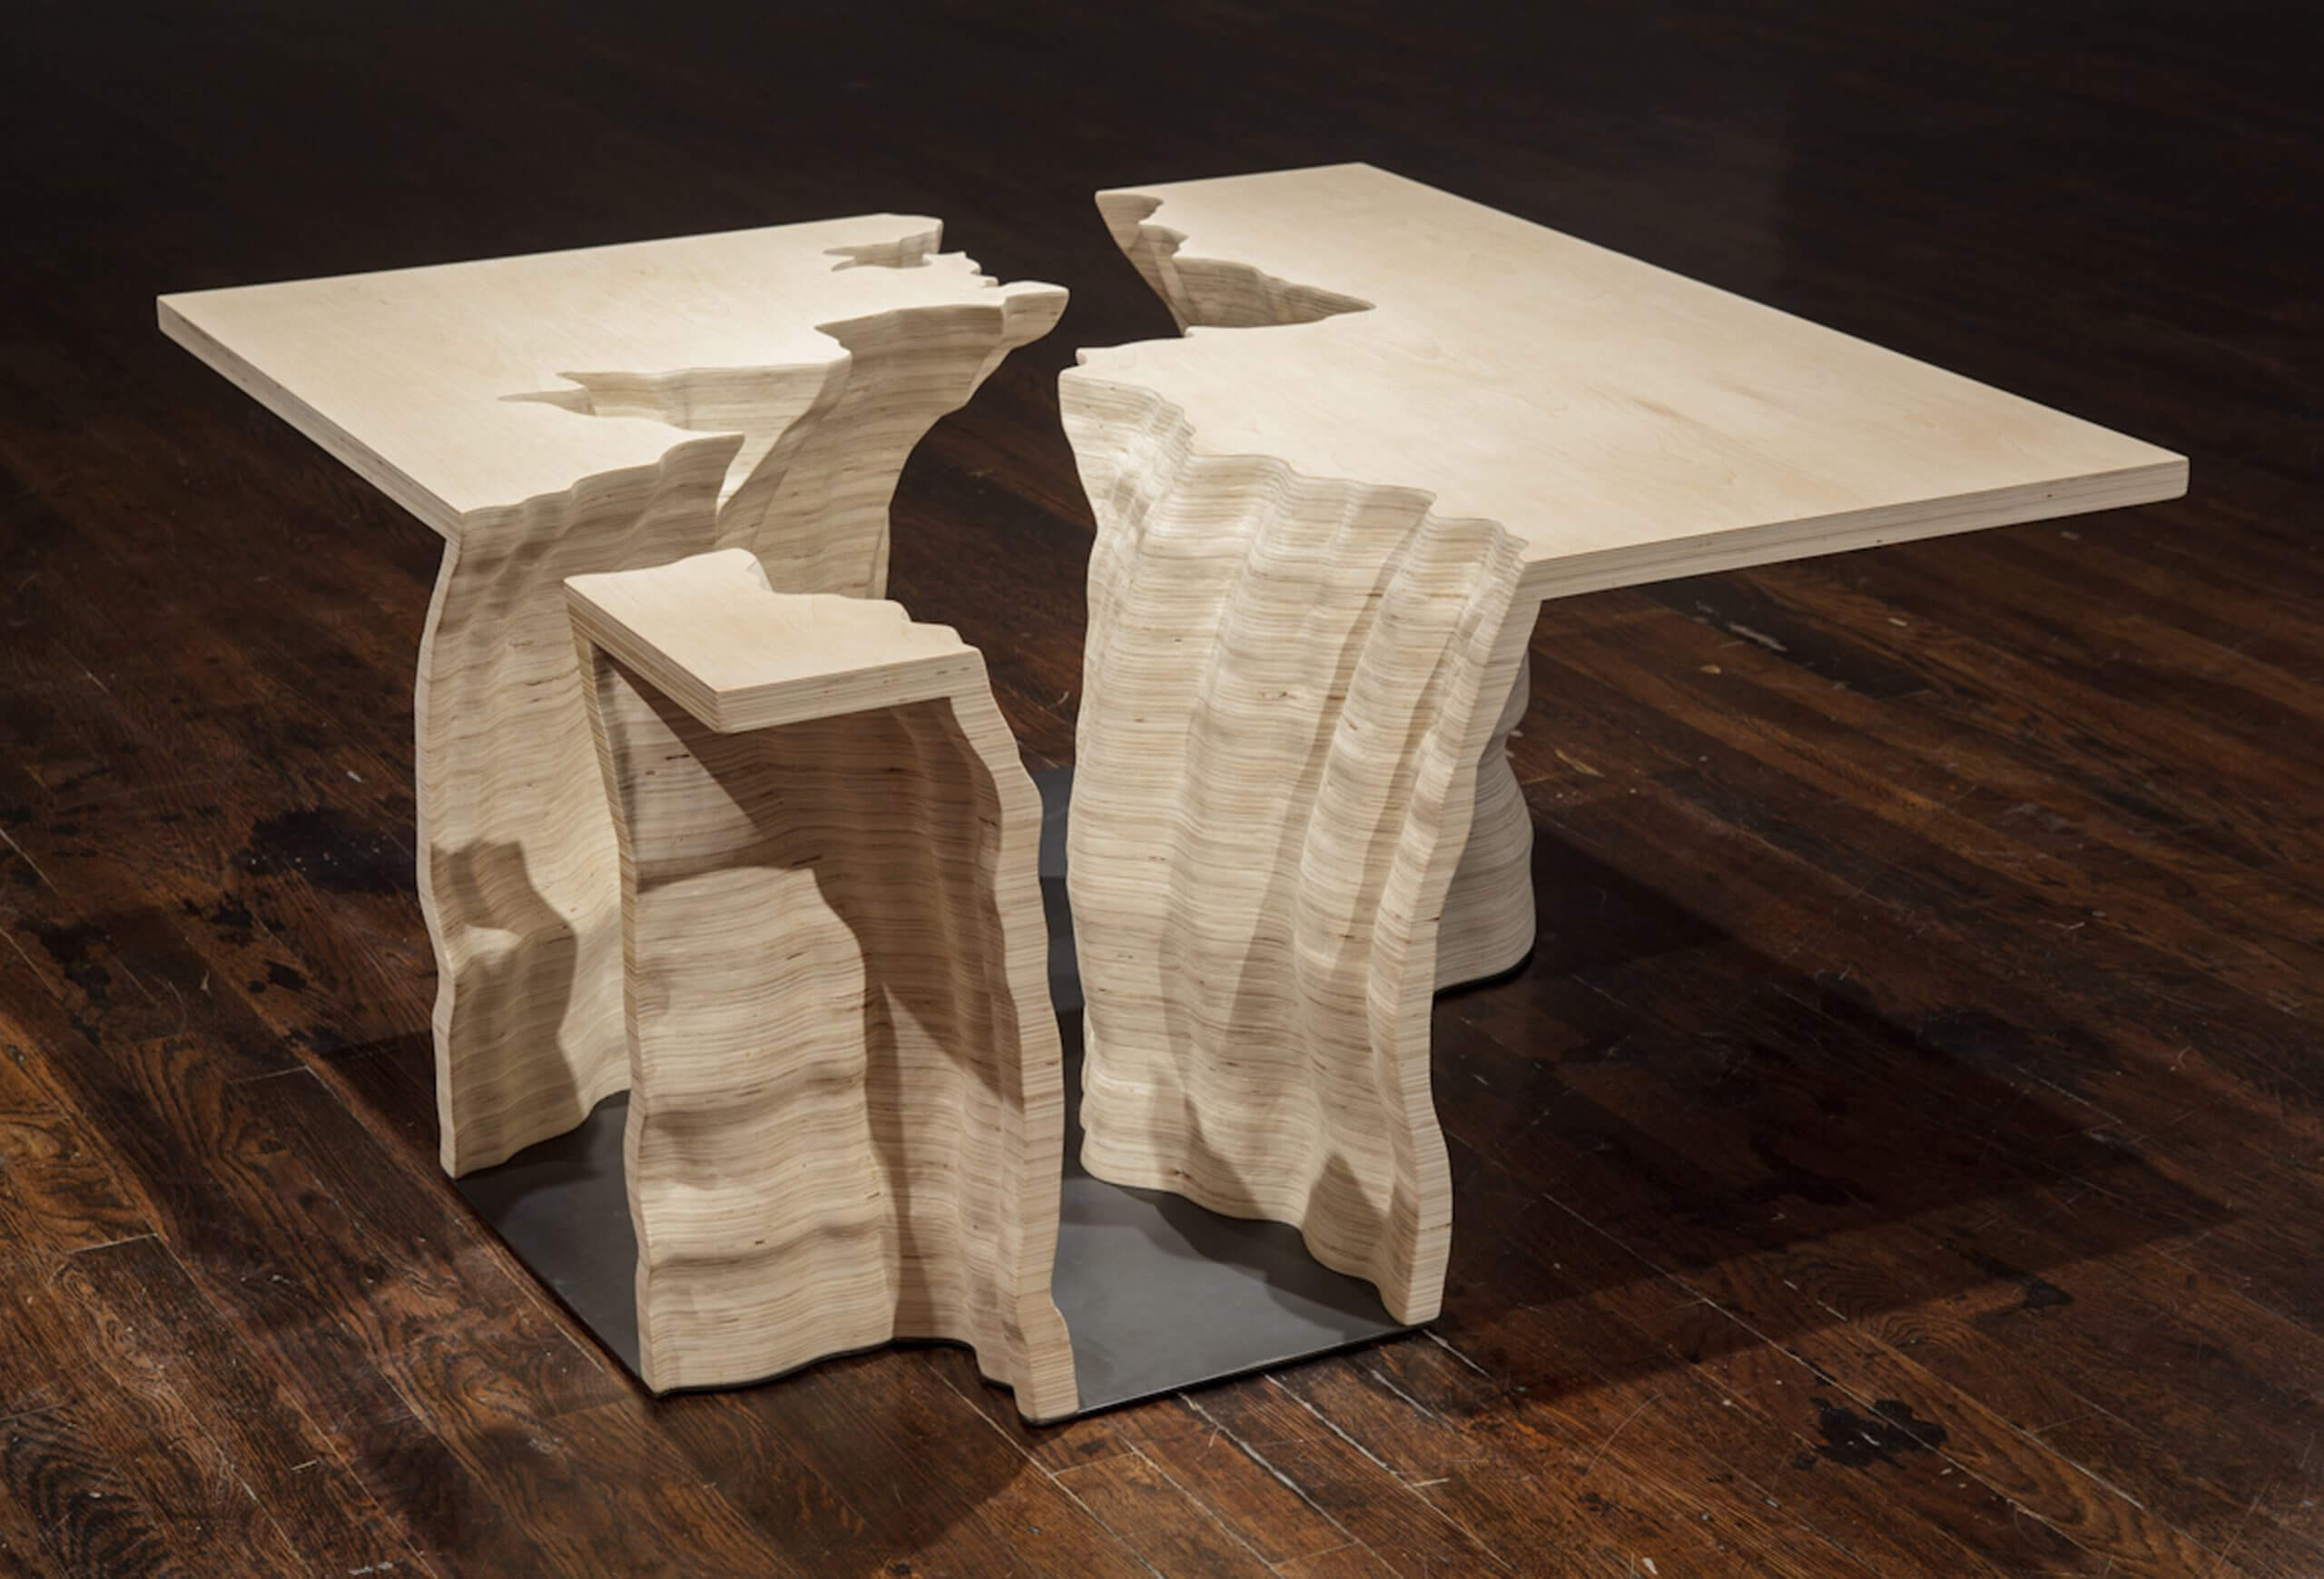
Trends in Water Use, 2013, plywood and steel, Adrien Segal. A data sculpture embedded with fifty years of water consumption statistics for the entire United States, sourced from a USGS publication. Images courtesy of the artist.
Trends in Water Use, 2013, plywood and steel, Adrien Segal. A data sculpture embedded with 50 years of water consumption statistics for the entire United States, sourced from a USGS publication. Image courtesy of the artist.
Material is complex, and can be utilized to enhance a data concept or can distract from it if not considered fully. On the surface, the physical properties of material can add to the tactile experience of touch through qualities such as texture, weight, hardness, transparency, and reflectivity. In fact, “Can I touch it?” is one of the most common questions I receive when my sculptural artwork is shown.
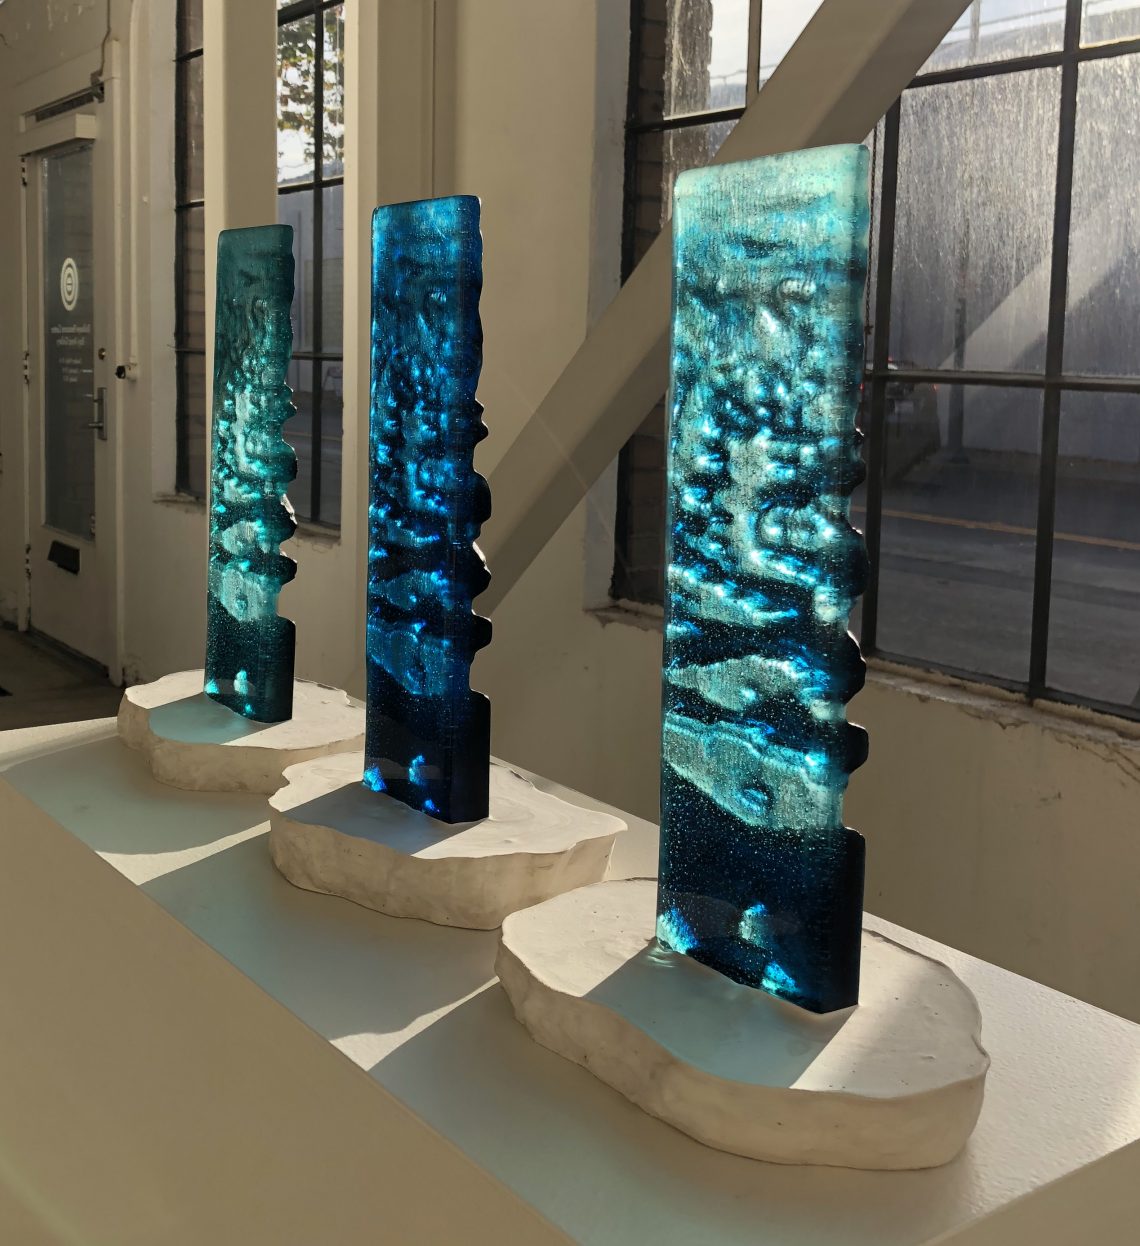
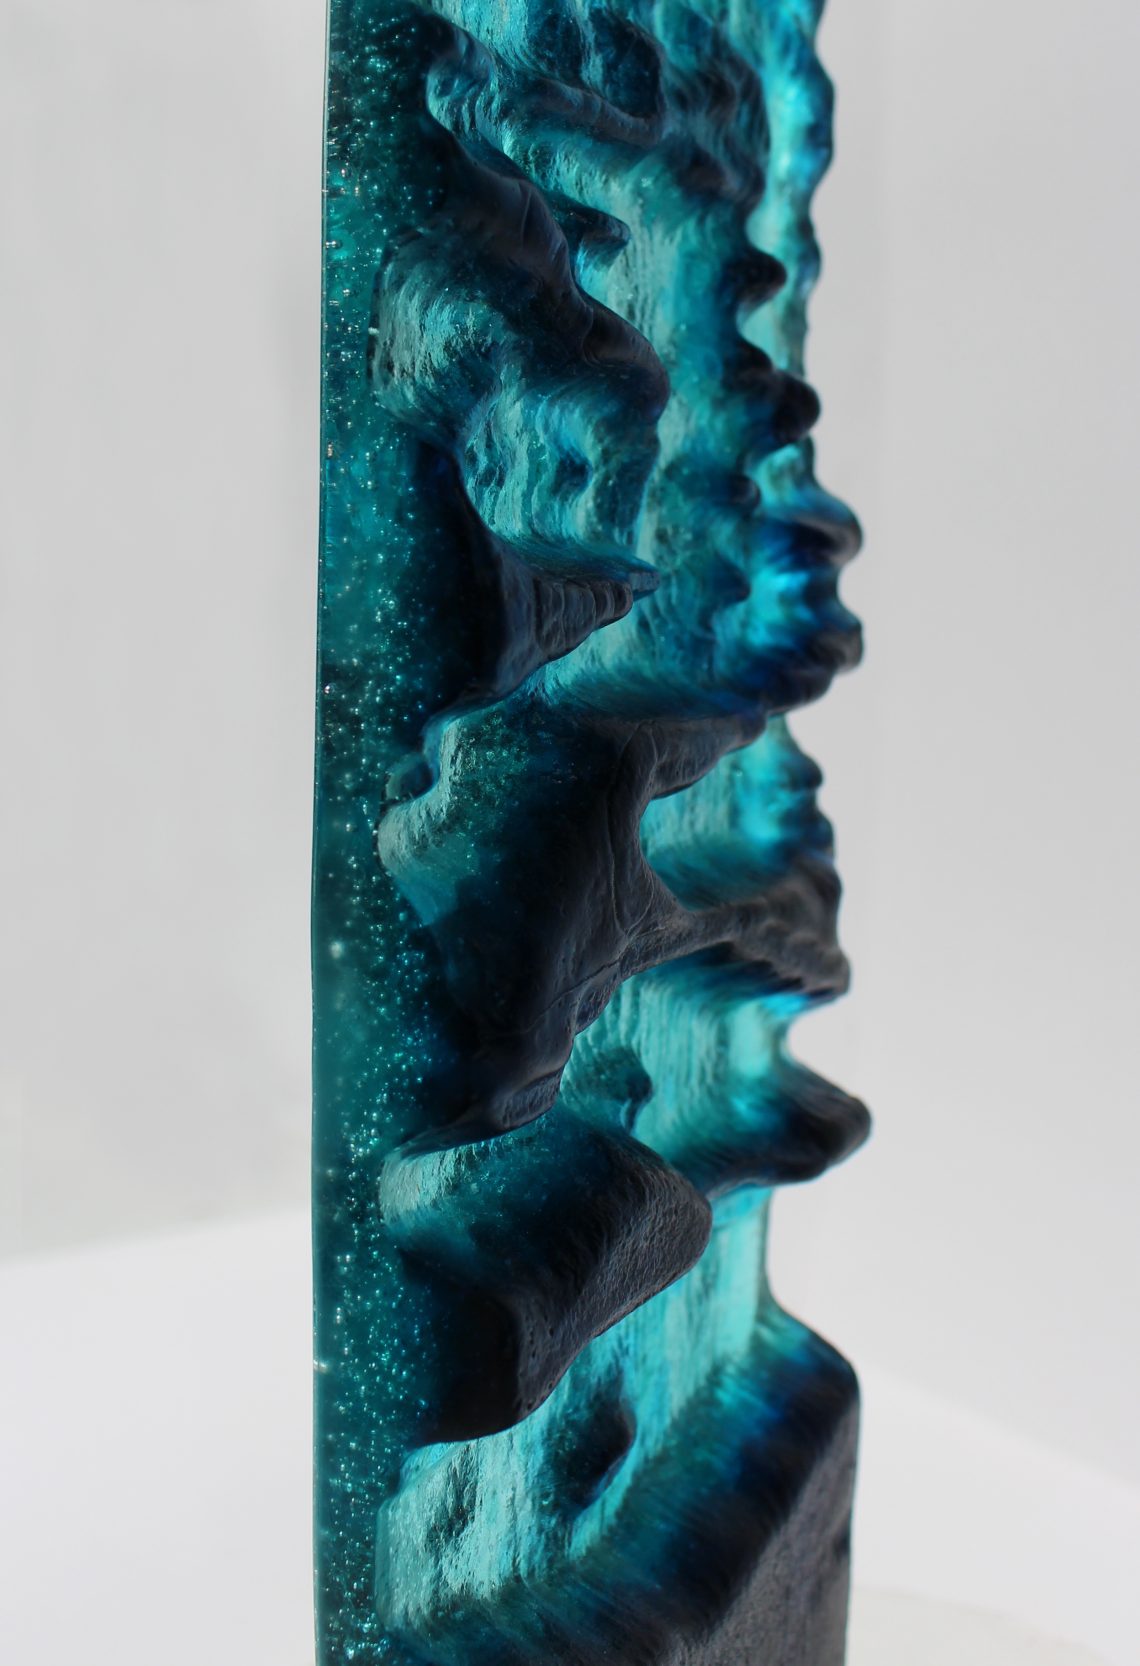
Arctic Sea Ice, 2017, cast glass, Adrien Segal. Images courtesy of the artist.
Indirectly, materials are situated in relation to the landscape and to their historic and cultural context. For example, Yule marble, from which the Lincoln memorial is carved, is sourced from Yule Creek Valley in the mountains of Colorado. In geology, marble is metamorphosed limestone, and historically, marble has a prolific presence in architecture and figurative sculpture. (In fact, stone sculpture is one of the earliest forms of art, predating painting on cave walls.) Culturally, marble has become a symbol of tradition and refined taste.
In my artwork series titled Arctic Sea Ice / Albedo, I translated photographic data of Arctic sea ice patterns into a digitally modeled surface. The form was cut using a CNC router and kiln cast in glass. The data concept is physically embodied through the translucent material quality of glass. Depth is conveyed in graduated tones of blue and the glass even captures tiny air bubbles.
California Water Rights, 2018, aluminum and ball chain, Adrien Segal. A data-based sculptural installation in a building in downtown San Francisco, California. Photo credit: Austin Dickenson.
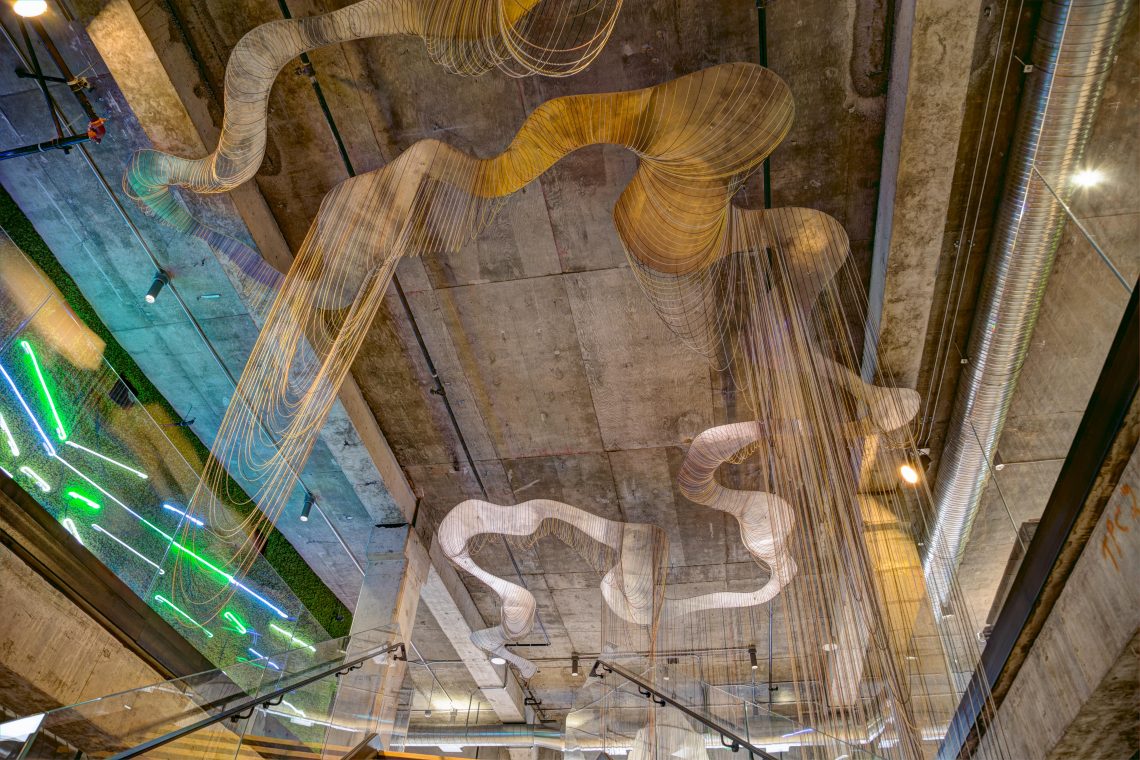
Space relates to the area, distance, and also the setting in the case of site-specific data based artworks. California Water Rights is a permanently installed immersive sculpture I created that spans three stories in an atrium of a San Francisco building. Strands of ball chain are draped above and around the stairways, hung from a meandering river following the flow of movement and people in the space. Each of the 1,072 strands represent the largest permitted water users. There are over 11,000 feet of ball chain in the sculpture, conveying the immense amount of water allocated for use in California.
Experience as the key to knowledge
How might physicalized data help us sift through and filter the immensity of data we are surrounded by into meaningful knowledge and insights that are useful, actionable, and help shape our understanding of the world? If we investigate how knowledge is synthesized from information, we find that experience and perception are key. It is important to note that experience is something that personally affects one’s life, and as such, information can only become knowledge subjectively, in a thinking, feeling person.
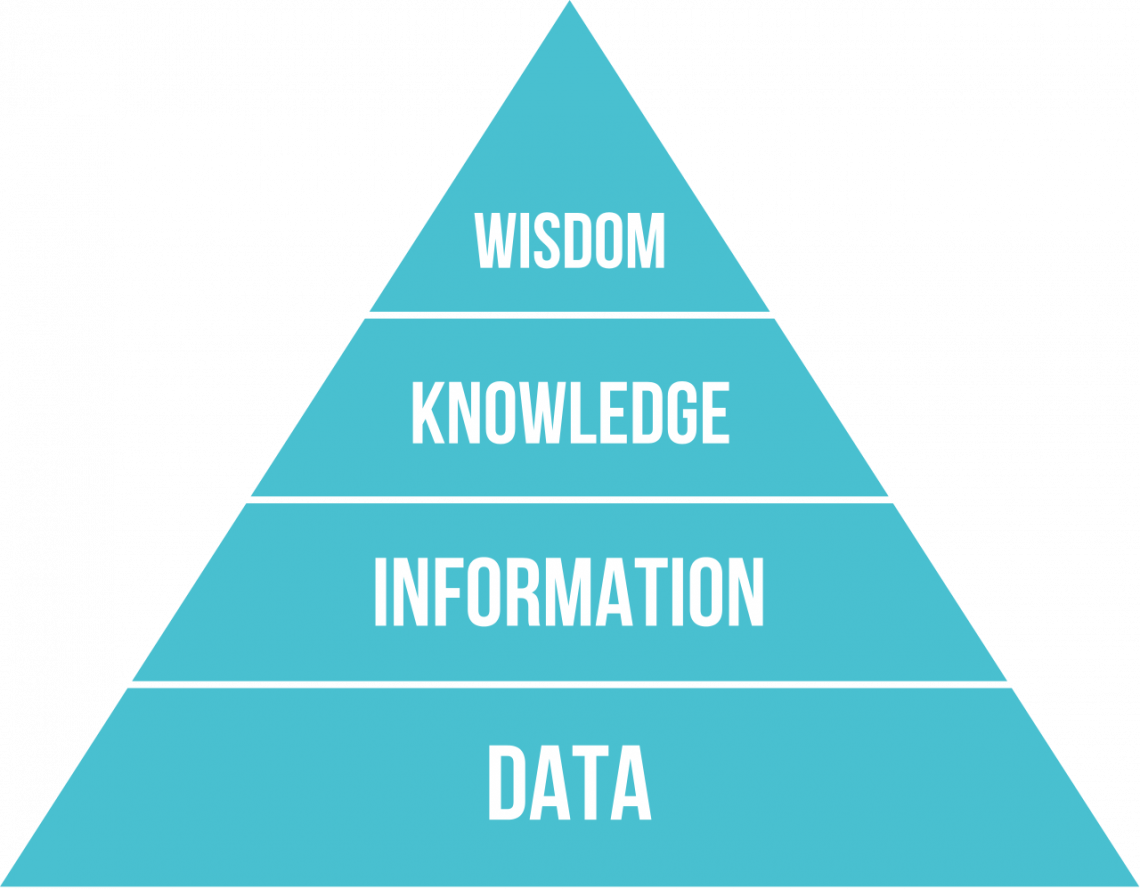
The DIKW Pyramid, Image sourced from Wikipedia.
knowledge
n. a familiarity, awareness, or understanding of someone or something, such as facts, information, descriptions, or skills, which is acquired through experience or education by perceiving, discovering, or learning.
Theories set forth in Art as Experience, a wonderful book by philosopher and educational reformer John Dewey (1859–1952) have deeply influenced my views on how art objects can expressively communicate ideas, meaning, and information through experience. Dewey believed that in greater society, art is mistakenly defined as an object, when in fact, the term art is actually a catalyst for the artist and the active observer to encounter each other in both material and mental environments. From this viewpoint, artworks are actually a medium for experience.
I want to close this thought by pointing out that although it is critical that the scientific collection of data remain as objective as humanly possible, what happens to the data after that is open to interpretation. Artists and designers can bring their knowledge of form, material, and three-dimensional space to present information in tangible ways that can help people make meaningful and personal connections to data in ways that tabular or purely visual data may not.
Data physicalization is a medium that has the ability to provoke the synthesis of knowledge by facilitating meaningful experiences. Looking forward, let’s consider how designers and artists can help bridge the gap between scientific objectivity and the emotional nature of human experience.
Tips for creating your own data physicalization
> Begin anywhere
John Cage tells us that not knowing where to begin is a common form of paralysis. His advice: begin anywhere. Start in the middle as necessary, and work your way back if it allows your idea to gain momentum.
For someone with no experience working with data, I would point you to Dear Data, a data postcard exchange between two information designers, Stephanie Posavek and Georgia Lupi. The book documents their process of observing, collecting, and hand drawing personal data for an entire year.
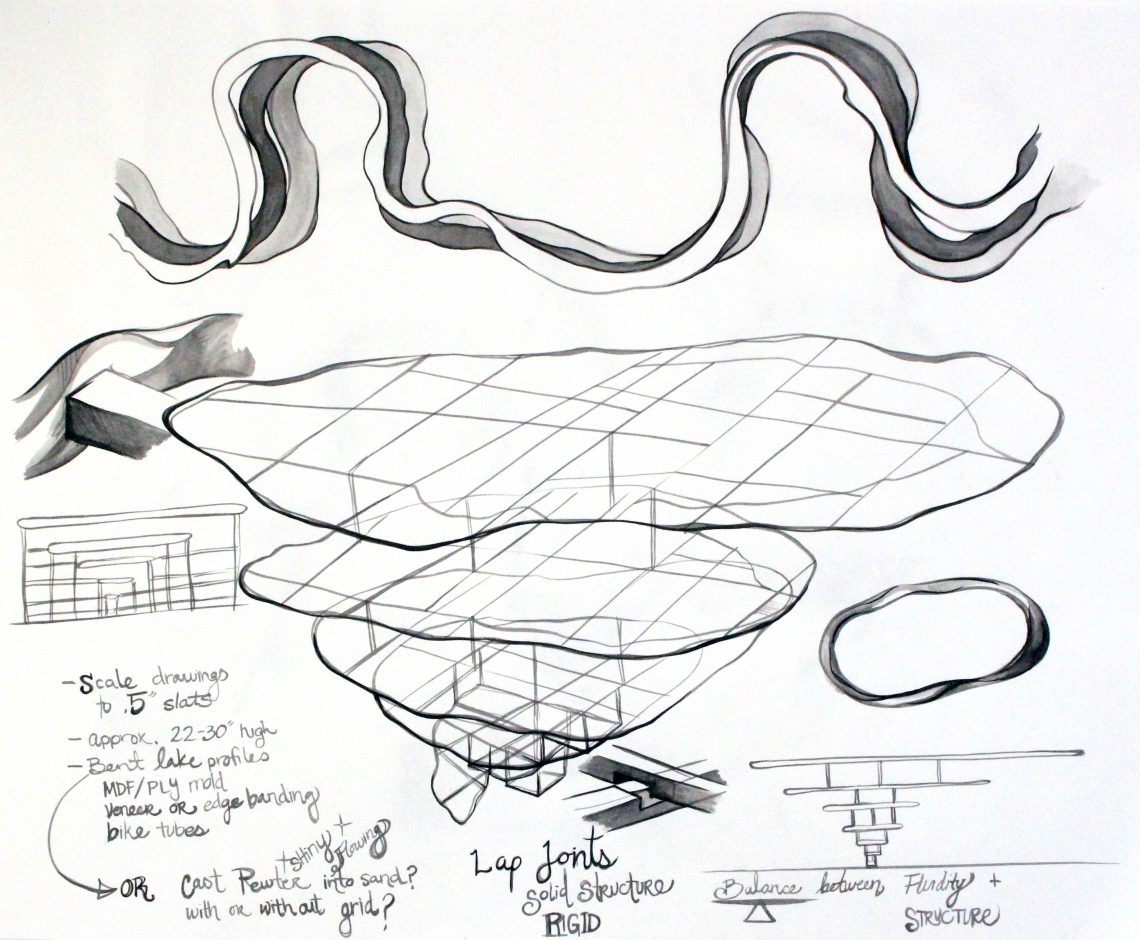
Concept sketching, ink on paper. Image courtesy Adrien Segal.
> Draw draw draw
Drawing is a nonverbal thinking process. Working out my ideas on paper is essential to problem solving the method of translation from two to three dimensions. Drawing is an immediate and direct expression and is best without constraints or inhibitions.
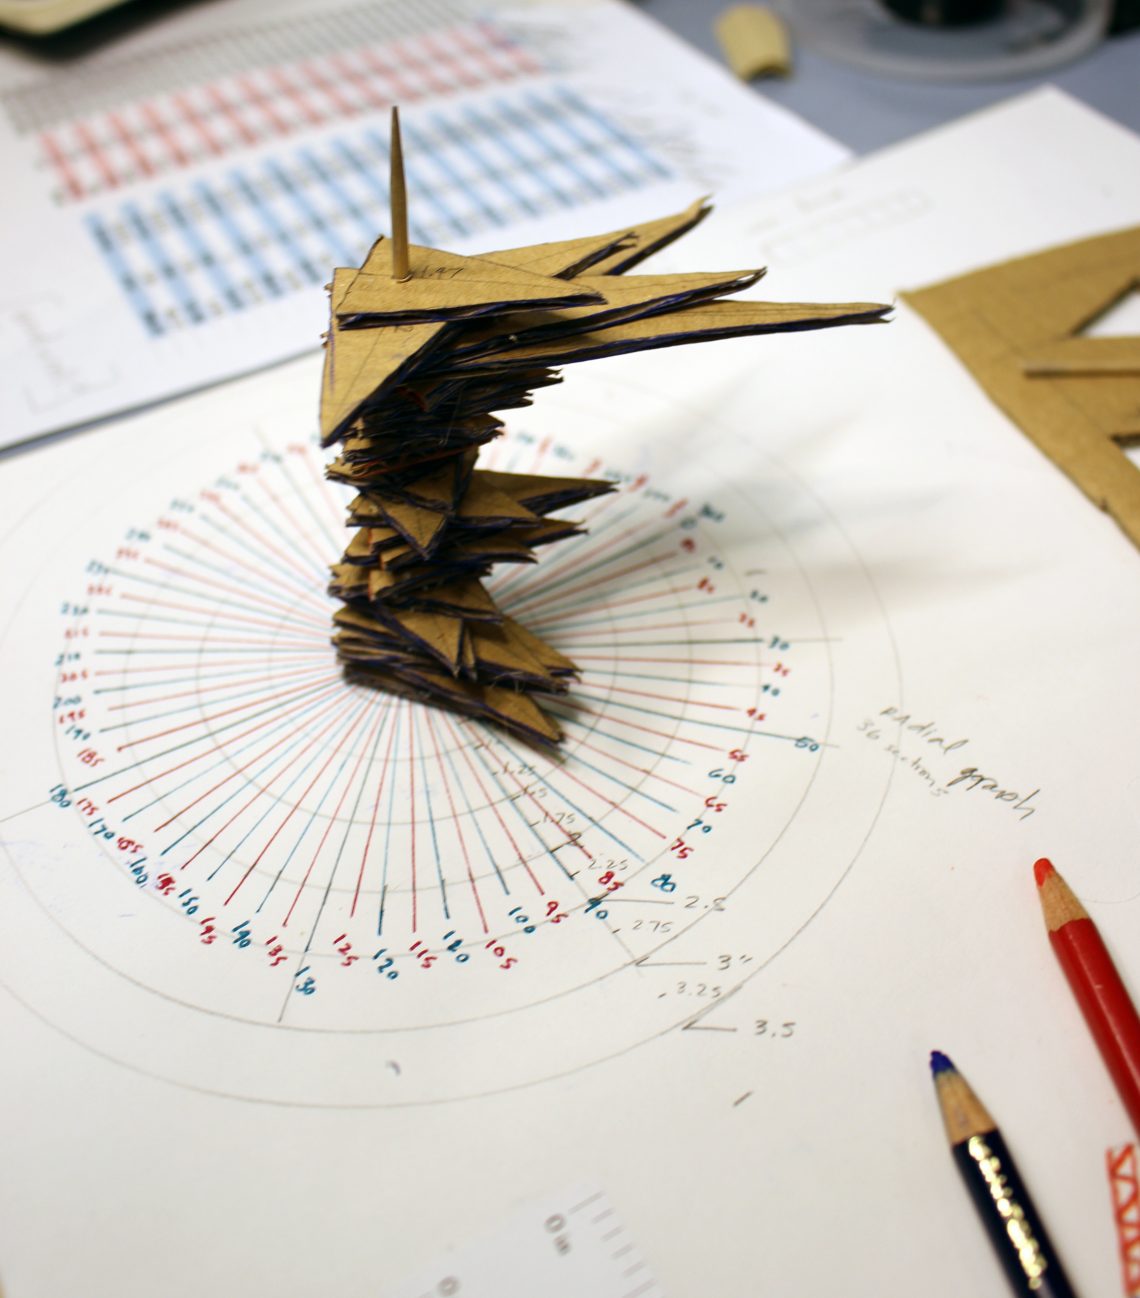
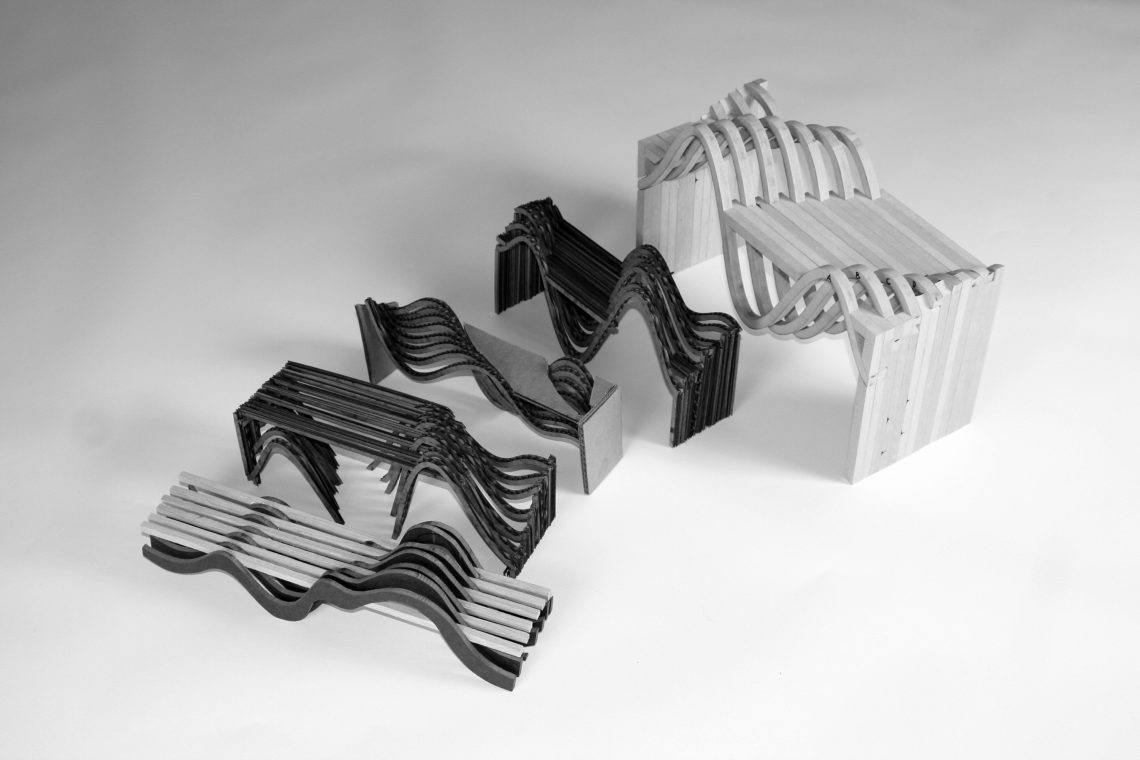
Process photos of data physicalizations using cut paper, ink, and cardboard. Images courtesy Adrien Segal.
> Simple materials, datasets, processes
Begin working with materials that are accessible and easy to find—thick paper, cardboard, thread, toothpicks, ink, clay—whatever helps you define forms directly with your hands. Also, it is much easier to work with 10 data points than 1000 data points, so begin with a small sample before committing to a method or process.
> Quick iteration and prototyping
Prototyping is a quick way to test your ideas in 3D space. Quick iteration involves making many versions of an idea in quick succession, a process of refinement that eventually leads you closer to your desired result. Emphasize quantity over quality.
> Build on the skills you already have…
…and you’ll learn new skills as you go. Technology is not required to make data physical—it can be a helpful tool, but may not be accessible, so don’t let it stop you.
> Don’t look at other designs for inspiration
Rather, draw from your own experiences.
Source unknown. Image courtesy Adrien Segal.
> This is a process
Be patient, be persistent, and trust that if you are dedicated you will end up exactly where you need to be. If you get stuck, put it aside for a time and come back to it with a fresh perspective.
Adrien Segal is an artist based in Oakland, California. Her work has been exhibited internationally in galleries and museums, and is published in several books and academic journals. She has been an Artist in Residence at the Bunnell Art Center in Alaska, Facebook Headquarters, the Pier 9 Workshop, Bullseye Glass, the Schmidt Ocean Institute, and Benchspace in Ireland.
Adrien received a BFA in Furniture Design from California College of the Arts in San Francisco. In addition to teaching, she pursues her creative practice out of her studio on the former Naval Base in Alameda, California.