In 2020, one in five adults in the United States experienced a mental health issue, yet less than half of those individuals will seek mental healthcare services. That means that tens of millions of individuals in the US continue to struggle without professional intervention.
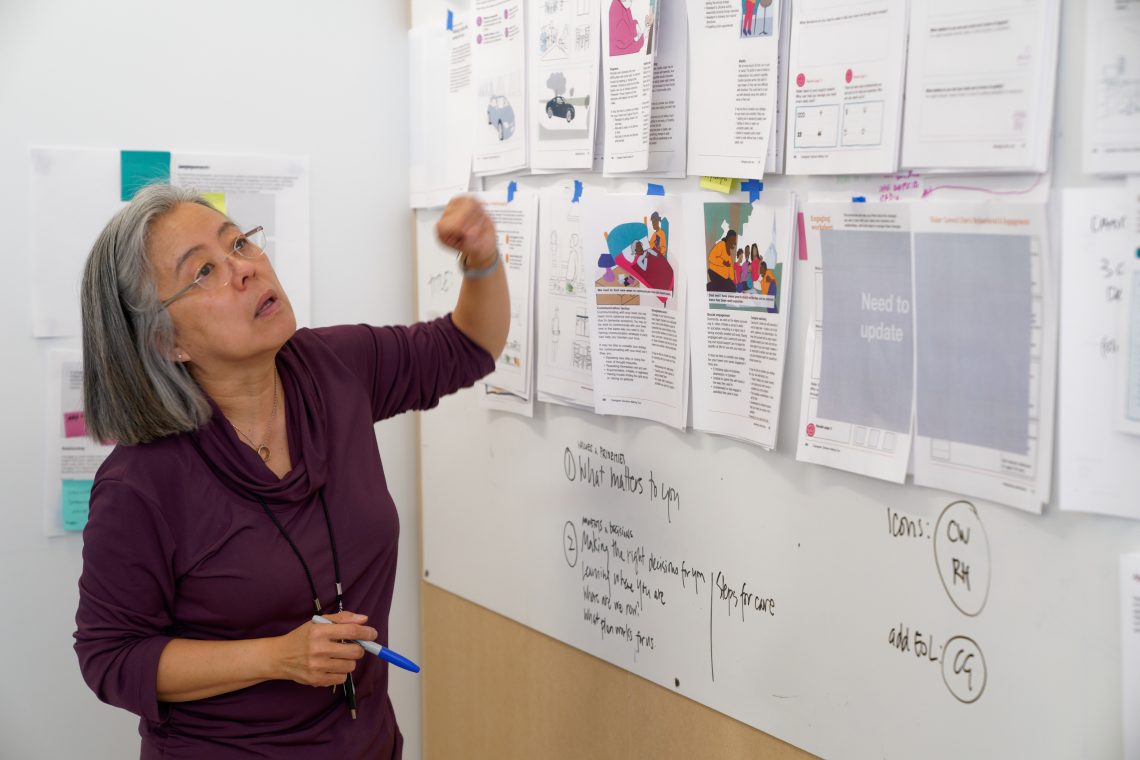
SocialWorks is a Chicago nonprofit serving and empowering underrepresented Chicago youth. Among SocialWorks’ five initiatives is “My State of Mind,” which aims to connect Chicagoans with mental health services. In fall 2021 SocialWorks partnered with the Institute of Design to create data visualizations for its data on mental healthcare services in Chicago. The group of students—led by Clinical Professor Tomoko Ichikawa—went much further than the initial proposal.
“I wanted the students to get qualitative data through interviews so we could make data visualizations that are inquiry-driven based on the needs from the audience,” says Ichikawa. “In talking to therapists, clinicians, and youth advocates, we were able to learn there are a lot of information gaps around mental health issues. How could we support youth with information on issues that they wanted to learn about and better understand?”
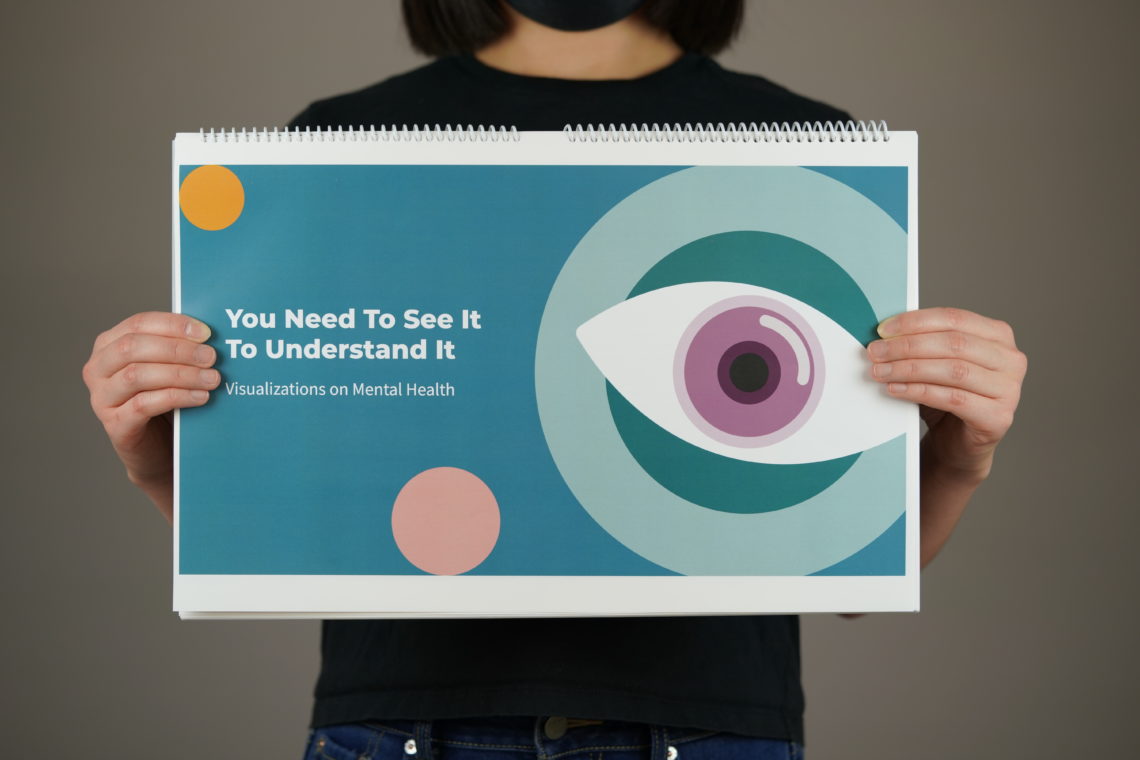
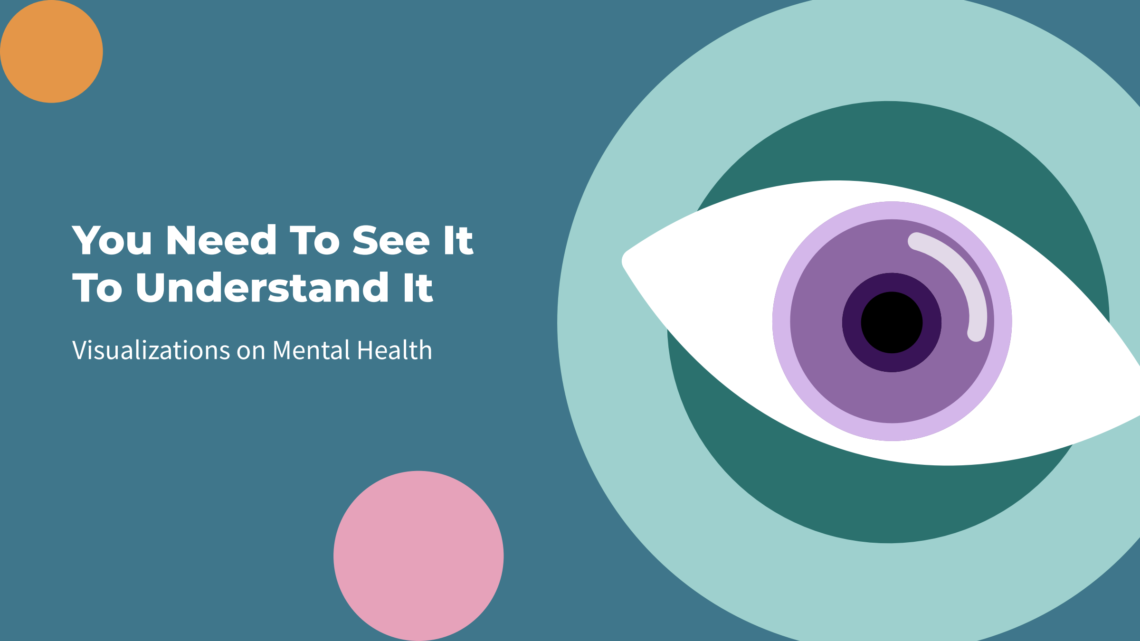
The end result is a suite of visualizations called “You Have to See It to Understand It,” which makes information about mental health more accessible to the layperson.
The catalog starts with the “Myself,” concentrating on individual symptoms and the needs associated with mental health issues. Next is “My Social Circle,” where visualizations provide information on how to communicate issues around mental health with friends and family. The catalog then ends with “My Community,” which shows mental health resources and contextualizes how the issue of mental health has been treated in Chicago.
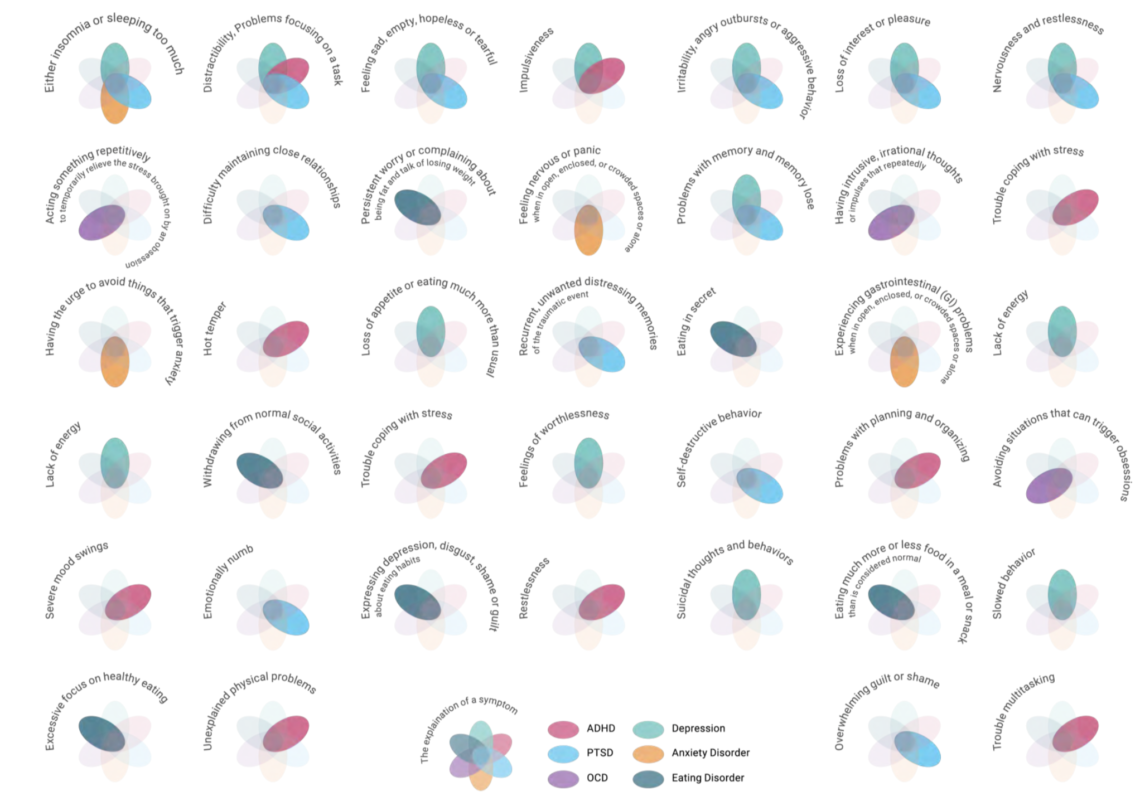
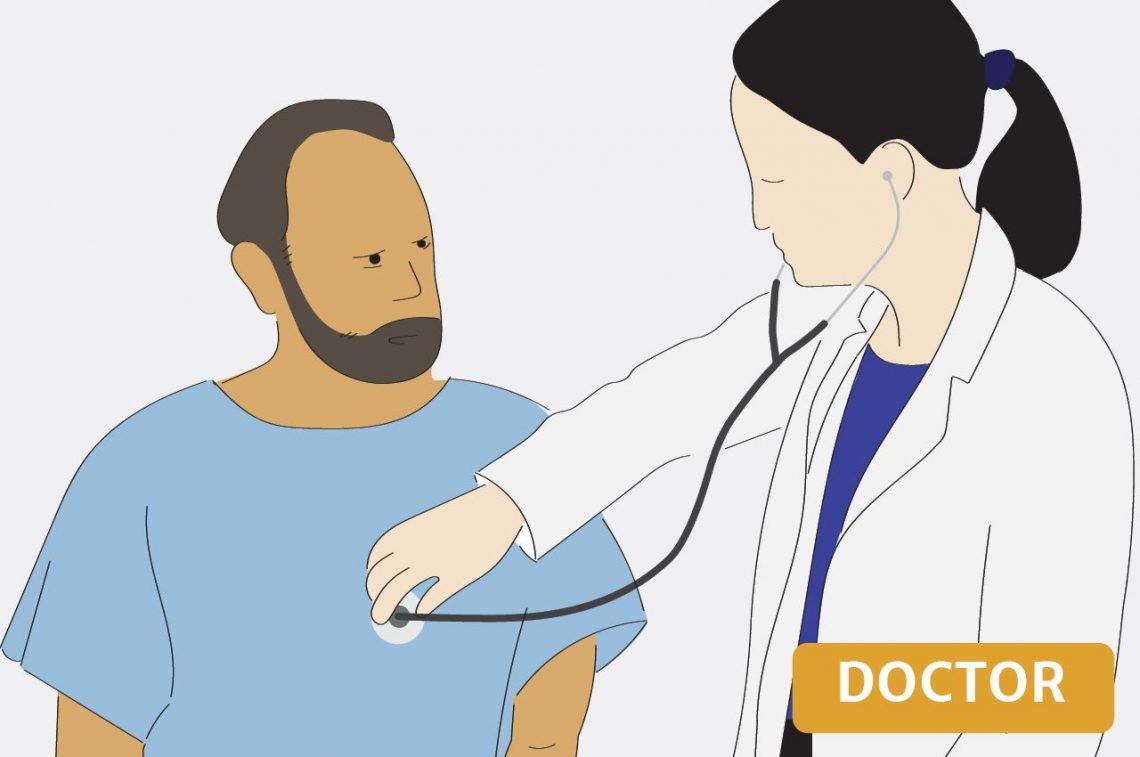
Among the visualizations in the “Myself” section is a dashboard of statistics about how many people live with mental health issues. Similarly, a forum for people to share their experiences in living with mental health issues is meant to destigmatize them and make viewers feel less alone. An interactive visualization maps out the common warning signs of six common mental health issues; clicking on one shows potential associated symptoms, helping users recognize the possibility that they might need to seek support.
“We thought awareness of those symptoms is important before visiting a clinic,” says Sue Kim (MDes 2022), one of the visualization’s authors. “Users should understand that first so they can get the proper support they need.”
For “My Social Circle,” visualizations are centered around how to facilitate conversations with loved ones. A visualization called “How to Have a Safe Conversation” charts supportive and non-judgemental language and provides information on non-verbal cues that facilitate productive conversations about mental health.
Finally, “My Community” looks beyond individuals. The section makes the case for intervening at the community level to share information and promote the health of not just individuals but entire communities, eschewing the traditional individualistic clinical approach and instead empowering community members with the knowledge and resources to implement proactive approaches to mental health issues.
As such, it provides comprehensive data, mainly provided by SocialWorks, about where certain mental health services are located in the city, breaking down certain factors like cost, proximity to public schools and outdoor spaces, and accessibility by public transit. A proposed poster provides comprehensive information on mental healthcare facilities that accept Medicaid.
Yet while these visualizations support access to mental health resources that individuals might have trouble finding, another set of visualizations aims to educate on the broader context of mental health issues in Chicago. For instance, an interactive timeline authored by Parker and Sara Park (MDes 2022) details the history of mental health issues in Chicago from the opening of university neurology and psychology departments in the 1930s in Chicago to the closure of half of the city’s public mental health clinics (which were located on the city’s South and West Sides) in 2012.
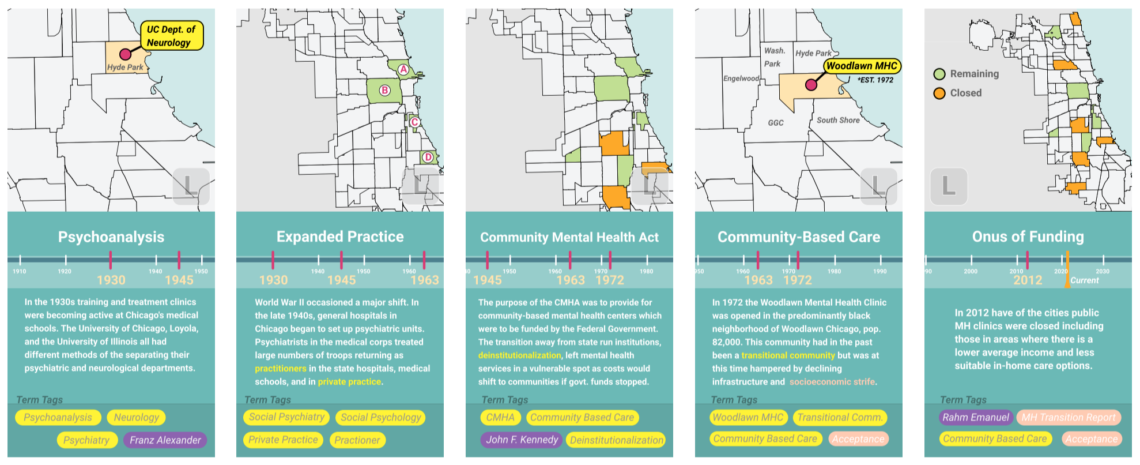
“It’s meant to give you a sense of place and feeling of understanding of where you’re from to better understand the history of where you are. It was less about saying, ‘OK, I’m going to go get therapy myself,’ and more to advocate for the larger point of mental health,” says Parker. “You find that there are aspects of mental health that have not been covered historically, or something in the history triggers you to use yourself and your personal network to figure out how to advocate for a better future for yourself and the community.”
The visualizations and concepts developed by ID students provide SocialWorks with the opportunity to integrate these new ideas into its “My State of Mind” community programming. Through physical print materials and digital app-based experiences, they represent new ways of making ideas in mental healthcare more accessible to Chicago and the young people that the organization serves.
“We have to reimagine the process so people have the tools to move forward in a way that speaks to their characteristics, interests, hobbies, and cultures,” says Cunningham. “When you supplement these tools with the resources that ‘My State of Mind’ has, this is a huge win.”
Tags:
Students
- Urvi Bidasaria
- Samira Cohanim
- Kavya Rai
- Sue Kim
- Ujjwal Anand
- Aamena Ansari
- Gauri Bhatt
- Elizabeth Engele
- Ruohua Huang
- Parker Joyner
- Sun Park
- Sara Park
- Arijit Patra
- Kelvin Yu
- Minyi Zhang